如何愉快的在PhpStorm中进行Xdebug断点调试?
在前进的路上 2019-06-27
前言
- 如果你厌烦了
print_r、log、var_dump这类一次调试一行的方式 - 如果你的业务复杂到一层又套一层,打 log 都救不了你的思路
- 如果你了解断点调试,但是还没有在
PhpStorm中配置过 - 如果你想在
前端页面 按菜单或按钮 调用API时,断点调试后端代码 - 如果你想在
Postman访问 API 时,断点调试后端代码
参考文档
如何愉快的在PhpStorm中进行Xdebug断点调试:https://blog.csdn.net/RobotYa...
如何愉快的在PhpStorm中进行Xdebug断点调试:https://segmentfault.com/a/11...
PHP xdebug 模块下载:https://xdebug.org/download.php
PHP xdebug 模块检测和下载:https://xdebug.org/wizard.php
Xdebug helper 浏览器插件:https://www.crx4chrome.com/cr...
PhpStorm 本地断点调试:https://blog.csdn.net/qq_2138...
PHP 安装 Xdebug 模块
Windows
- 这里我用的是
Wamp3.1.0_x64,已经默认安装了php_xdebug - 因此只需要在菜单的 php 拓展内将
php_xdebug启用即可
- 如果 没有安装 xdebug 或
PhpStorm提示 xdebug版本与php版本不符,则需要自行下载 xdebug
- 打开本地终端,执行
php -r 'phpinfo();',复制终端输出的所有 phpinfo 信息 访问地址:https://xdebug.org/wizard.php ,粘贴 phpinfo 信息到输入框,点击按钮进行分析当前 phpinfo 适配的 xdebug 版本,然后进行下载
- 检测
phpinfo,并下载对应xdebug版本
- 检测
查看
php.ini的xdebug配置,确保xdebug.remote_enable = On启用; XDEBUG Extension [xdebug] zend_extension ="C:/Users/robot/Program/Wamp/Wamp3.1.0_64/bin/php/php5.6.31/zend_ext/php_xdebug-2.5.5-5.6-vc11-x86_64.dll" xdebug.remote_enable = On xdebug.profiler_enable = off xdebug.profiler_enable_trigger = off xdebug.profiler_output_name = cachegrind.out.%t.%p xdebug.profiler_output_dir ="C:/Users/robot/Program/Wamp/Wamp3.1.0_64/tmp" xdebug.show_local_vars=0
Linux
参考文档
下载 xdebug.tgz 安装包
Ubuntu
参考文档
安装 xdebug 模块
sudo apt-get install php-xdebug
查看所有模块
php -m
查找 xdebug 安装后的扩展路径
find /usr/ -name 'xdebug.so'/usr/lib/php/20151012/xdebug.so
查找 php.ini 所在路径
php -i|grep 'php.ini'或php -r 'phpinfo();'- 可能的位置
/etc/php/7.0/cli/php.ini或/etc/php/7.0/apache2/php.ini
- 编辑 xdebug 配置
[xdebug]
zend_extension="/usr/lib/php/20151012/xdebug.so"
xdebug.remote_enable=1
//xdebug.remote_handler=dbgp
//xdebug.remote_mode=req
//xdebug.remote_host=127.0.0.1
//xdebug.remote_port=9000
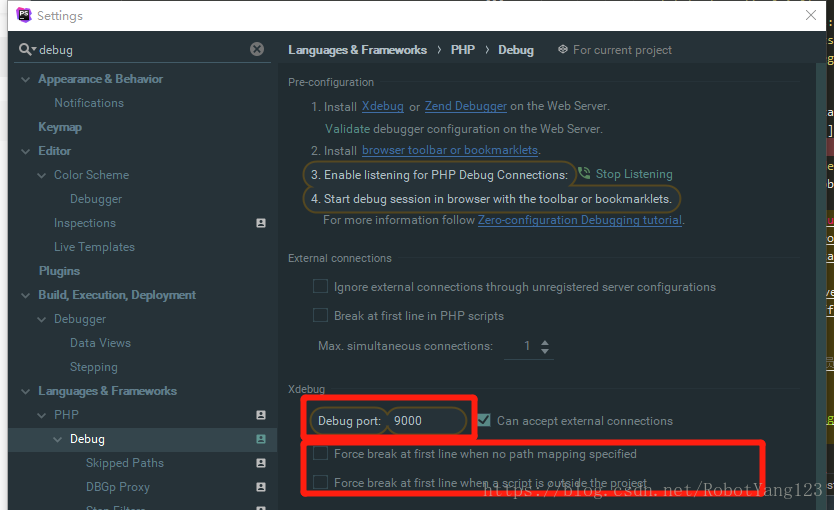
PhpStorm 配置 debug connections 服务
- 在工具栏中选择 File -> setting
搜索关键词 debug,选择 Languages & Frameworks 下的 PHP -> Debug
- 配置默认
端口 9000 - 取消强制中断
- 配置默认
配置与调试
多种调试配置方式:本质都是在
cookie中自动添加XDEBUG_SESSION=PHPSTORM- 使用
浏览器Xdebug Helper插件设置idekey,用 debug 启动访问时,然后 cookie 会自动添加XDEBUG_SESSION 使用
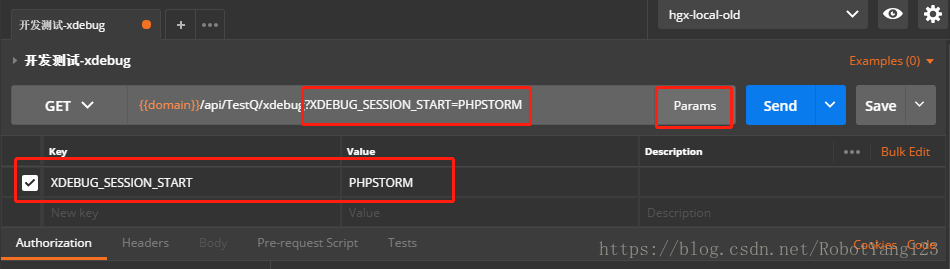
请求体 request中设置XDEBUG_SESSION_START=PHPSTORM请求参数,然后 cookie 会自动添加XDEBUG_SESSION- 在请求的
URL后追加,如http://localhost:500/api/TestQ/xdebug?XDEBUG_SESSION_START=PHPSTORM - 在请求的
body中追加,如request.body.XDEBUG_SESSION_START=PHPSTORM
- 在请求的
- 使用
PhpStorm配置Debug Configuration 与 Servers,用 PhpStorm debug 启动访问时,URL会自动追加XDEBUG_SESSION_START 请求参数,然后 cookie 会自动添加XDEBUG_SESSION
- 使用
浏览器 Xdebug Helper 插件方式
优缺介绍
优点:
- 无需 PhpStorm 配置 Debug Configuration 与 Servers
只要配置一致的
idekey=PHPSTORM或在 cookie 中添加XDEBUG_SESSION=PHPSTORMXdebug Helper配置idekey=PHPSTORM后,在启用 debug 模式时,会自动在当前访问 url 所在域名(如 localhost:500)下的 cookie 中添加XDEBUG_SESSION=PHPSTORM前端只需要任意页面启用 Xdebug Helper 的 debug 模式即可,原理如上(但要确认你的 client request 携带的 cookie 可以正确到达 server requestPostman只需要指定域名(如 localhost)的cookie中添加一次XDEBUG_SESSION=PHPSTORM即可PhpStorm中只需开启Listening Debug Connections(就是顶部路径栏中右边那个小电话图标)
缺点:
- 需要安装 Xdebug Helper
安装 Xdebug helper 插件
- 下载
Xdebug Helper插件的crx文件,在浏览器扩展程序中拖放安装即可 - 配置插件选项,在插件上右键菜单选择“选项”,配置
idekey如下

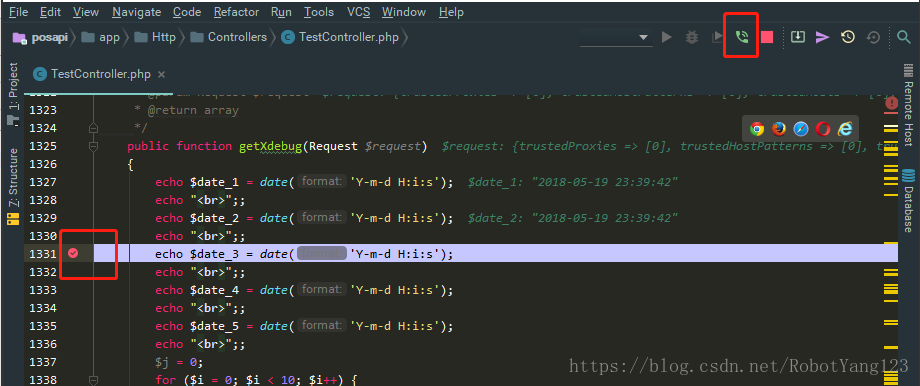
启用测试断点调试
PhpStorm
- 在 PhpStorm 中启动你的
小电话 - 设置断点
- 在 PhpStorm 中启动你的
- 浏览器 URL / 前端 URL(启动 Xdebug helper 插件的
debug 模式)

- 然后访问你的调试文件 或者 API 地址
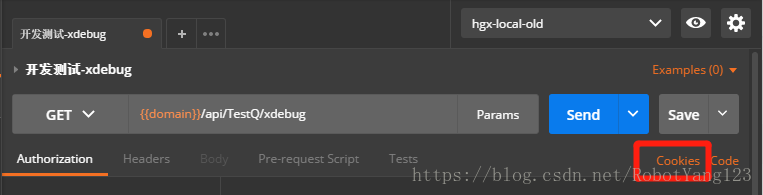
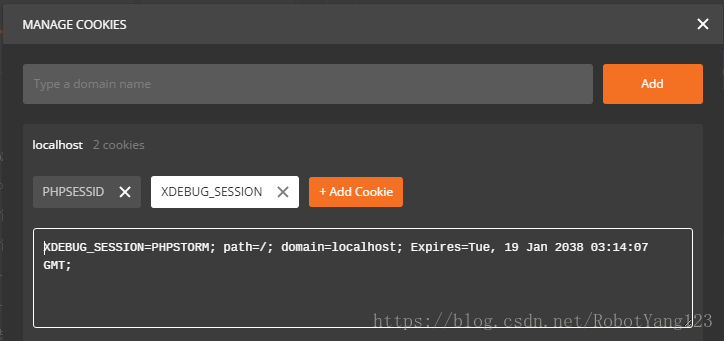
Postman URL
- 在指定域名(如 localhost)的
cookie中添加一次XDEBUG_SESSION=PHPSTORM
- 在指定域名(如 localhost)的
前端 node.js / express.js 等
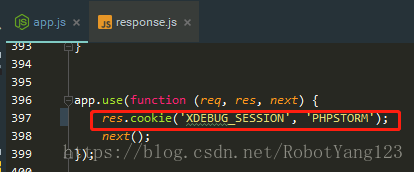
- 按上面的逻辑,应该是在 cookie 中添加
XDEBUG_SESSION=PHPSTORM,如response.cookie('XDEBUG_SESSION', 'PHPSTORM'); - 我这里用的是
node.js + express.js直接在app.js中全局注入了 XDEBUG_SESSION 的 cookie
- 按上面的逻辑,应该是在 cookie 中添加
 - 虽然浏览器控制台的 Application 也显示 XDEBUG_SESSION 的 cookie 被正确写入 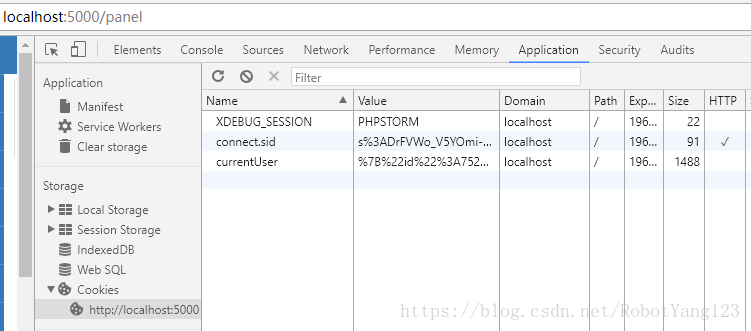 - 然后后台 API 却没有收到该 cookie,所以 PhpStorm 的 debug 也没有生效,**原因待查……**
请求体 request 中通过 XDEBUG_SESSION_START 请求参数 方式
优缺介绍
优点:
- 无需安装 Xdebug Helper
- 无需 PhpStorm 配置 Debug Configuration 与 Servers
缺点:
- 需要在 request body 或 当前 URL 后追加
XDEBUG_SESSION_START=PHPSTORM请求参数
- 需要在 request body 或 当前 URL 后追加
PhpStorm 配置 debug connections 服务
- 与前文一致
启用测试断点调试
PhpStorm
- 与前文一致
浏览器 URL / 前端 URL
- 关闭 Xdebug helper 插件,即切换到
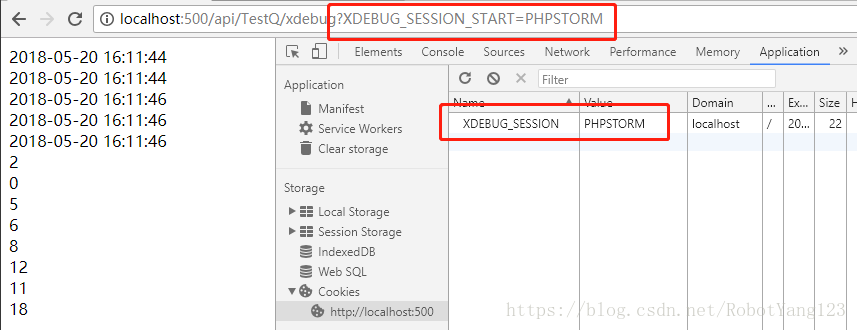
Disable 模式;或者直接卸载 - 在当前访问的 URL 后追加
?XDEBUG_SESSION_START=PHPSTORM
- 关闭 Xdebug helper 插件,即切换到
Postman URL
- 在当前访问的 URL 后追加
?XDEBUG_SESSION_START=PHPSTORM
- 在当前访问的 URL 后追加
前端 node.js / express.js 等
- 在 request body 中追加请求参数
XDEBUG_SESSION=PHPSTORM,如request.body.XDEBUG_SESSION_START='PHPSTORM'
- 在 request body 中追加请求参数
PhpStorm 配置 Debug Configuration 与 Servers 方式
优缺介绍
优点:
- 无需安装 Xdebug Helper
- 无需在 request body 或 当前 URL 后追加
XDEBUG_SESSION_START=PHPSTORM请求参数
缺点:
- 需要在
PhpStorm中配置 Debug Configuration 与 Servers - 配置完 PhpStorm 后,需要点击右上角的
甲壳虫图标,获取调试用的XDEBUG_SESSION_START=session_key
- 需要在
在 PhpStorm 中配置 Debug Configuration 与 Servers
- 点击右上角,选择
Edit Configurations - 点击
+ 号,新增一个 PHP Web Page - 点击 Server 右边的那个
...,先新建一个 Web 服务

- 然后点击右上角的
甲壳虫图标,获取调试用的XDEBUG_SESSION_START=session_key
- 复制这一对
XDEBUG_SESSION_START=12850,之后就是和《请求体 request 中通过 XDEBUG_SESSION_START 请求参数 方式》介绍的操作一样啦,这里不再赘述。 - 所以网络上的这一种调试方式相对繁琐多余,目前我也不知道有何意义。
查看断点信息

调试快捷键
- F7 通过当前行,进入下一行,如果该行是方法,则进入方法体
- F8 通过当前行,进入下一行,如果该行是方法,也直接进入下一行,不进入方法体
- F9 通过整个流程,全部顺序执行
要点总结
PHP安装xdebug模块,在 正确的php.ini下设置xdebug.remote_enable=1或者OnPostman在 API 域名下的cookie中添加XDEBUG_SESSION=PHPSTORMPhpStorm启动小电话,开启侦听

相关推荐
codeDig 0喜欢 / 0评论 2020-09-15
lemonzhangyan 0喜欢 / 0评论 2020-09-17
chenhaimeimeng 0喜欢 / 0评论 2020-09-15
icysonyk 0喜欢 / 0评论 2020-09-15
RemixGdc 0喜欢 / 0评论 2020-08-15
nicelife 0喜欢 / 0评论 2020-06-27
zhaowj00 0喜欢 / 0评论 2020-06-06
缘起宇轩阁 0喜欢 / 0评论 2020-04-22
xiaocainiao0 0喜欢 / 0评论 2020-04-22
nicelife 0喜欢 / 0评论 2020-03-26
poplpsure 0喜欢 / 0评论 2020-02-10
nicelife 0喜欢 / 0评论 2019-12-25
amberom 0喜欢 / 0评论 2019-12-05
ipromiser 0喜欢 / 0评论 2019-11-19
MXstudying 0喜欢 / 0评论 2019-11-17
spinachcqb 0喜欢 / 0评论 2019-11-04
ROES 0喜欢 / 0评论 2011-05-05
很青的青蛙 0喜欢 / 0评论 2010-10-07
lff 0喜欢 / 0评论 2008-11-05
sundujing 0喜欢 / 0评论 2019-08-20
song 0喜欢 / 0评论 2008-07-08
chenhailong 0喜欢 / 0评论 2015-08-21
dockerhc 0喜欢 / 0评论 2019-07-29
klarclm 0喜欢 / 0评论 2019-08-12
Phplayers 0喜欢 / 0评论 2019-04-23
歪脖子先生 0喜欢 / 0评论 2019-04-01
resilient 0喜欢 / 0评论 2019-08-16
chenhailong 0喜欢 / 0评论 2012-12-05
臻心依旧 0喜欢 / 0评论 2019-07-25
辛苦的字幕君小样 0喜欢 / 0评论 2013-10-18
stingfire 0喜欢 / 0评论 2012-05-16
歪脖子先生 0喜欢 / 0评论 2011-10-10
xiaocainiao0 0喜欢 / 0评论 2012-04-18
歪脖子先生 0喜欢 / 0评论 2012-04-18
qiyuandu 0喜欢 / 0评论 2011-12-13
hhxpnzdnh 0喜欢 / 0评论 2019-07-01
puddingpp 0喜欢 / 0评论 2019-07-01
xiaocainiao0 0喜欢 / 0评论 2019-07-01
hhxpnzdnh 0喜欢 / 0评论 2019-07-01
臻心依旧 0喜欢 / 0评论 2019-06-30
我的程序员人生 0喜欢 / 0评论 2016-10-14
臻心依旧 0喜欢 / 0评论 2019-06-30
chenhailong 0喜欢 / 0评论 2015-05-18
ipromiser 0喜欢 / 0评论 2019-06-30
臻心依旧 0喜欢 / 0评论 2019-06-29
chinaitv 0喜欢 / 0评论 2019-06-28
臻心依旧 0喜欢 / 0评论 2019-06-28